11 R을 활용한 기초통계 분석
Sketch
- Q-Q plot \(\rightarrow\) 데이터가 특정 분포를 따르는가?
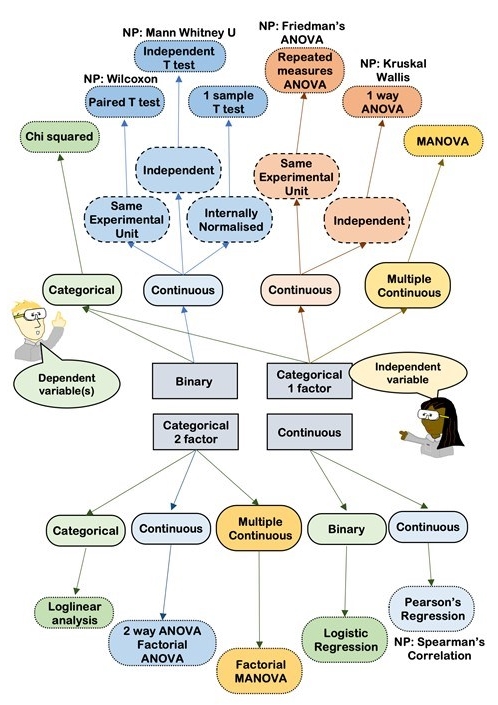
- paired t test, independent two sample t test \(\rightarrow\) 연속형 반응변수 vs. 범주가 2개인 범주형 변수
- Oneway ANOVA test \(\rightarrow\) 연속형 반응변수 vs. 범주가 2개 이상인 범주형 변수
- \(\chi^2\) & Fisher’s exact test \(\rightarrow\) 두 범주형 변수 간 연관성(독립성) 검정
- Correlation between two continuous variables \(\rightarrow\) Pearson’s correlation coefficient
